What are Data Drift and Concept Drift in Machine Learning ? MLOps Simply explained.
Once you have trained a successful machine learning model that meets the standards you want to achieve, you can celebrate it ! However, this is far from beeing the end of the story. In fact, most of the time it's the easiest part :D . Now, you have to make the model available at scale for users as an app. This step is called deployment.
Like any normal app, machine learning models may encounter bugs over time, so you occasionally have to change the code in order to fix them. By the way, as you changed the code, what you fixed might have changed the behaviour of other functions. You then have to make sure all the functions still behave the same way. This step is usually performed through unit testing and integration testing. Finally, you have to redeploy the whole app.
In addition, users may also request new features to enhance the app, so again you'll need to change the code, perform tests and redeploy it.
In a nutshell, there is an endless cycle: development, testing, deployment, monitoring, development, testing....
I think you can guess how annoying it would be to redo all these steps by hand each time.
You need to automate this process! The process of maintaing your app throughout the software development life cycle in such a fashion is called DevOps.
In machine learning, we have MLOps it sounds like DevOps but there's a difference. We have all the previous things to take care of... but we also have other sources of hassle. Indeed, the performances of your model can degrade over time. Typically, Data Drift and Concept Drift are common causes of performance degradation in machine learning models.
In this article, we will focus on the later two.
Monitoring the performances
To illustrate the point, let's consider a simple example of a machine learning model that measures the willingness to buy an Iphone given the age. Your model has a very good accuracy for now, however, as you are a fellow MLOps Engineer, you want to keep an eye on the metrics over time. In order to evaluate the performance of the model, you need to calculate the error between its predictions and the true values. Wait a second, How do we calculate the error if we don't have access to the true values at the time of prediction ? In many real use cases you can have access to the true values with a delay. In our example, let's assume that a month after the predictions, you know if the people have indeed bought the phone or not so you can record the predictions in logs and calculate the error later when the outcomes become available.
In January, your model achieved high accuracy.
In February your model's accuracy is very low.
What happened ? Is that even possible ? Does it come from the model ? Is it the Data ?
We need to investigate the possible causes of this discrepancy.
To begin the investigation, let's examine the model.
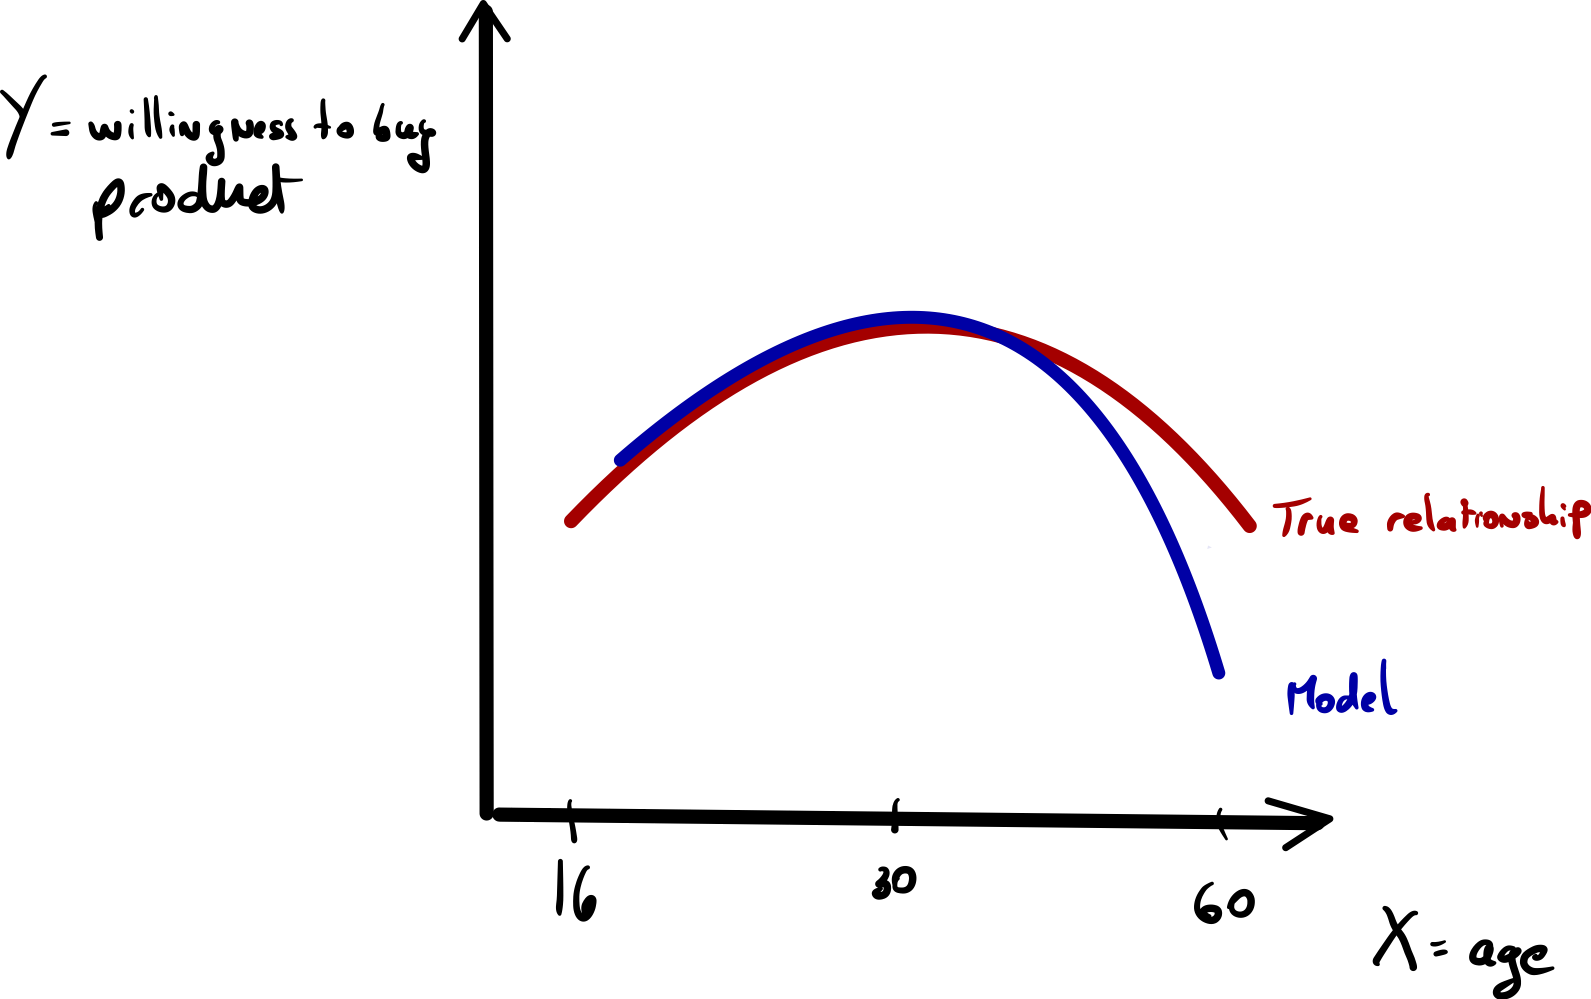
The blue line in this graph represents the predictions made by the model we trained. The red line shows the actual values that we are trying to predict.
The model appears to accurately predict most of the values of the target variable. A priori, it seems that the model is performing well overall.
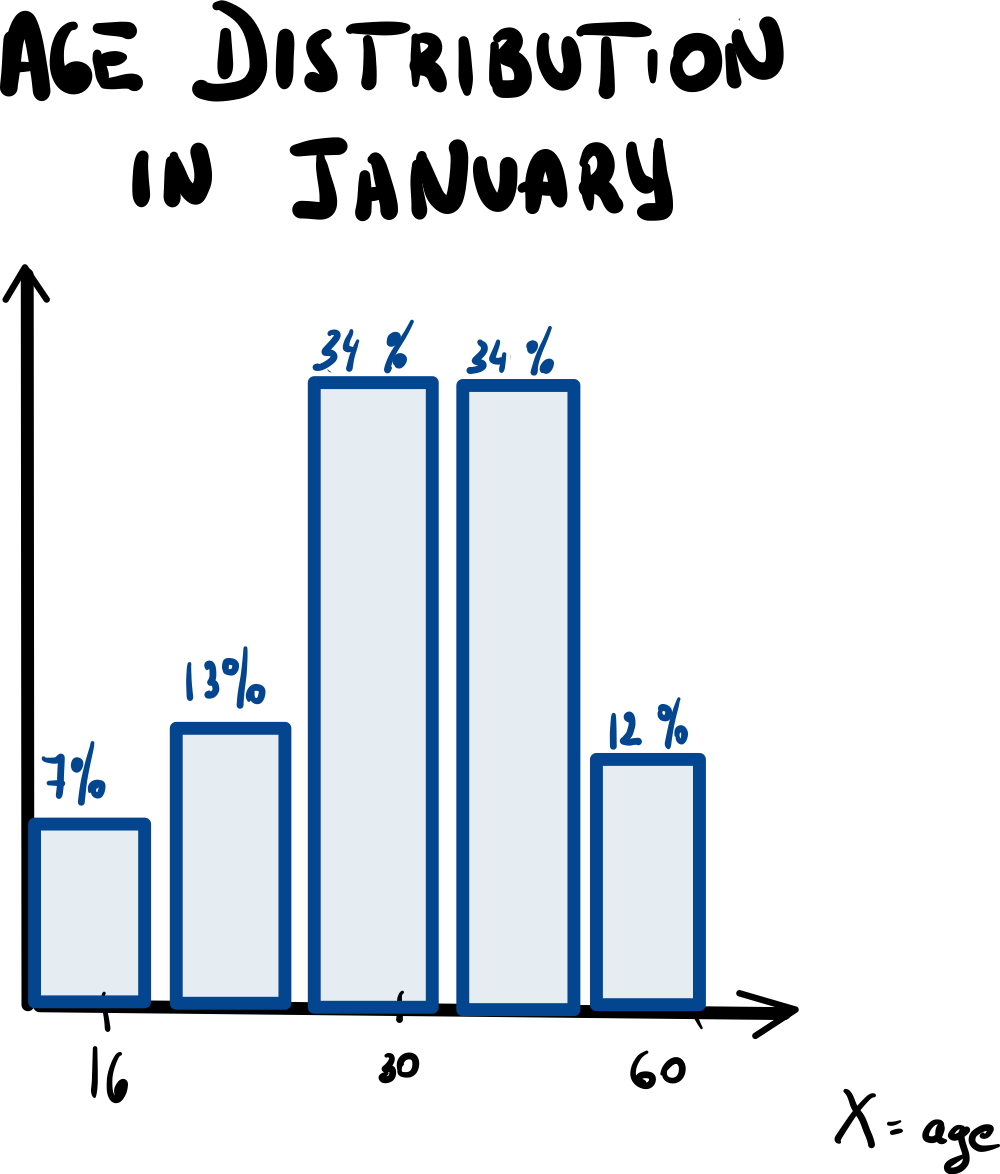
It seems to follow a bell curve or a normal/gaussian distribution in the statistics lingo.
The majority of individuals fall between the ages of 20 and 40. As you can see from the blue line on the previous graph, the model's predictions for these age ranges are almost perfectly accurate. The rest of the ages are under-represented. As a result, the model's overall average error is very low.
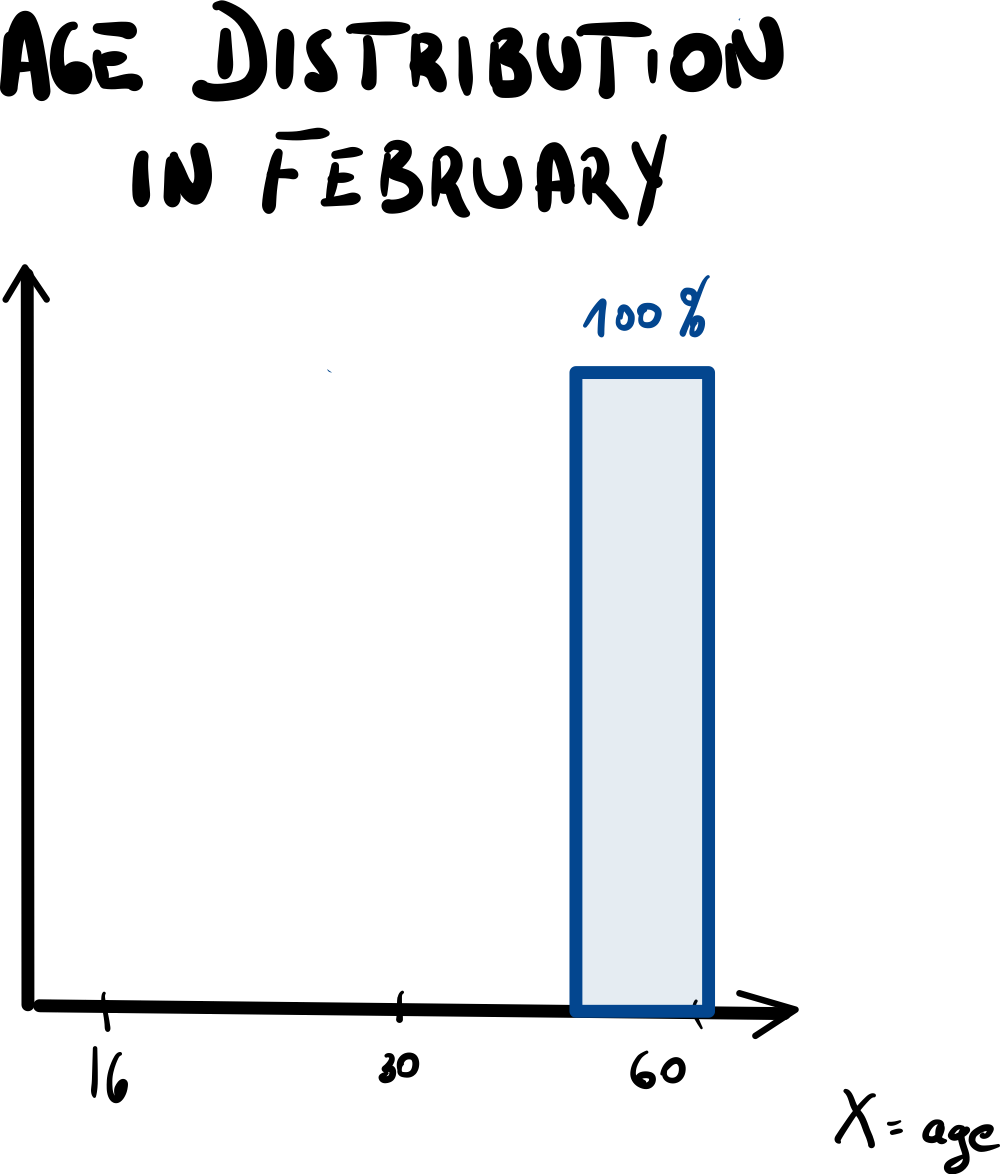
This is kind of extreme, but let's assume this is not a bug and that it reflects real market behavior.
Now, the model is still the same, but all the data we have has shifted towards the 50-60 years old age range. As a consequence, the model is performing very poorly because all the data is located in the area where the model has the highest error.
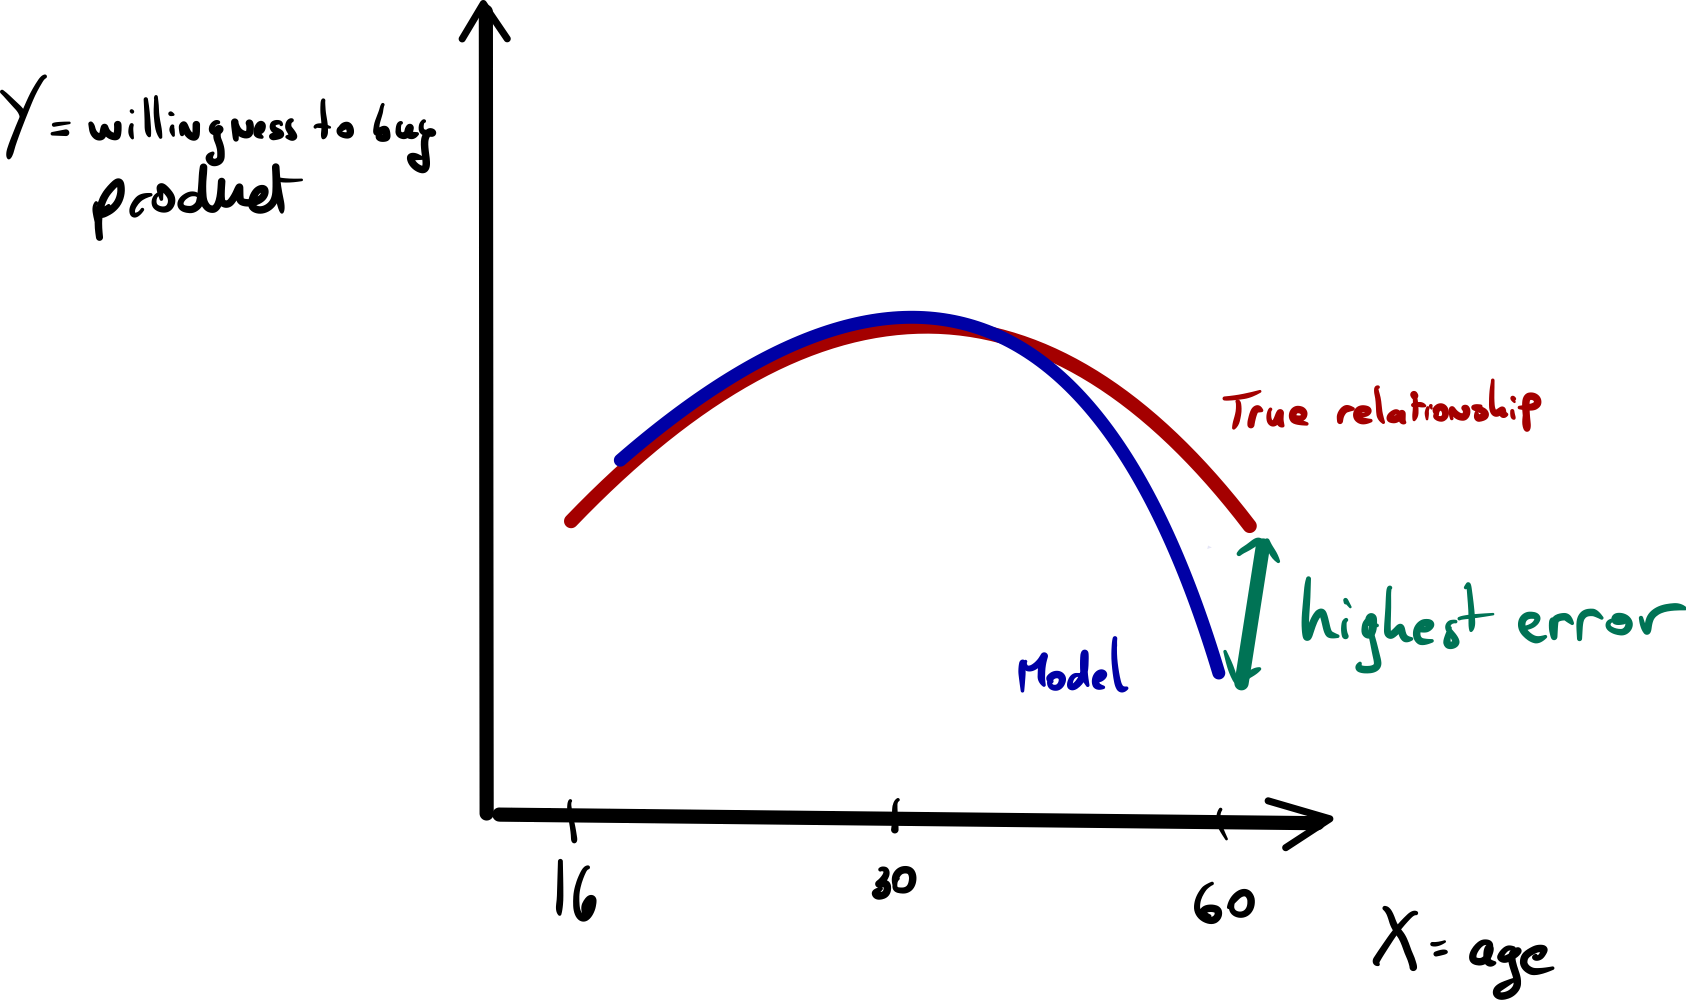
So overall, the average error is very high.
This is what we call a Data Drift
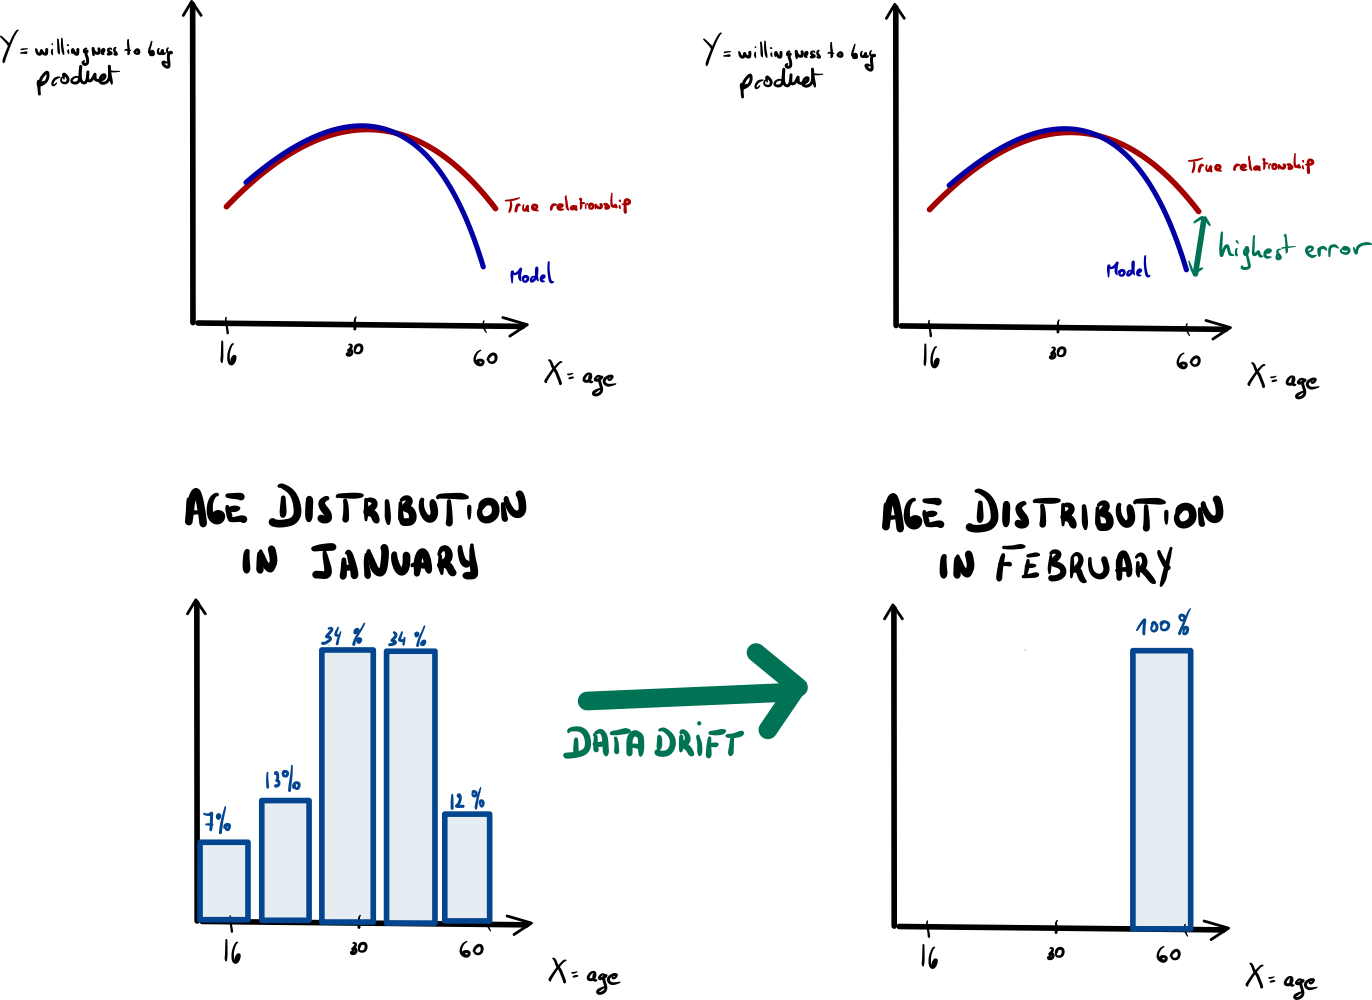
Again, my example is quite extreme, in general your distribution is just a little bit skewed but we can clearly see the impact that the distribution can have on the model.
How to detect Data Drift ?
In fact, when monitoring for Data Drift, we don't even need to use the predictions or the real values. We only need to check that the new data is approximately distributed like the original one. A simple thing to implement, for example, is to set an alert when the mean/median of the data becomes too different from the mean of the original data. Generally speaking, we should monitor statistical properties of the input data, such as the mean, standard deviation, and correlation coefficients. Of course, we can use more advanced tools like statistical tests, etc.
A Data Drift almost always harms your model's performance, and it should always raise attention as it can potentially cause significant problems for the model's accuracy and reliability.
How to address Data Drift ?
There are several things you can do:
- In our example we can retrain the model with the initial Dataset on which we'll add more data in the area where the model performs poorly (between 50 and 60) it could solve the problem.
- If the Data Drift is small, fine-tuning the model may be sufficient.
- If the data drift is significant, you may need to retrain the model on new data.
Concept Drift
Suppose it is September, and the model has been performing well until November.
However, in December, the model's performance has dropped significantly, even though the distribution of the data remains constant. So, what could be the reason behind this sudden drop in performance ?
Okay, now that should be the model's fault, right ?
Let's see what happened.
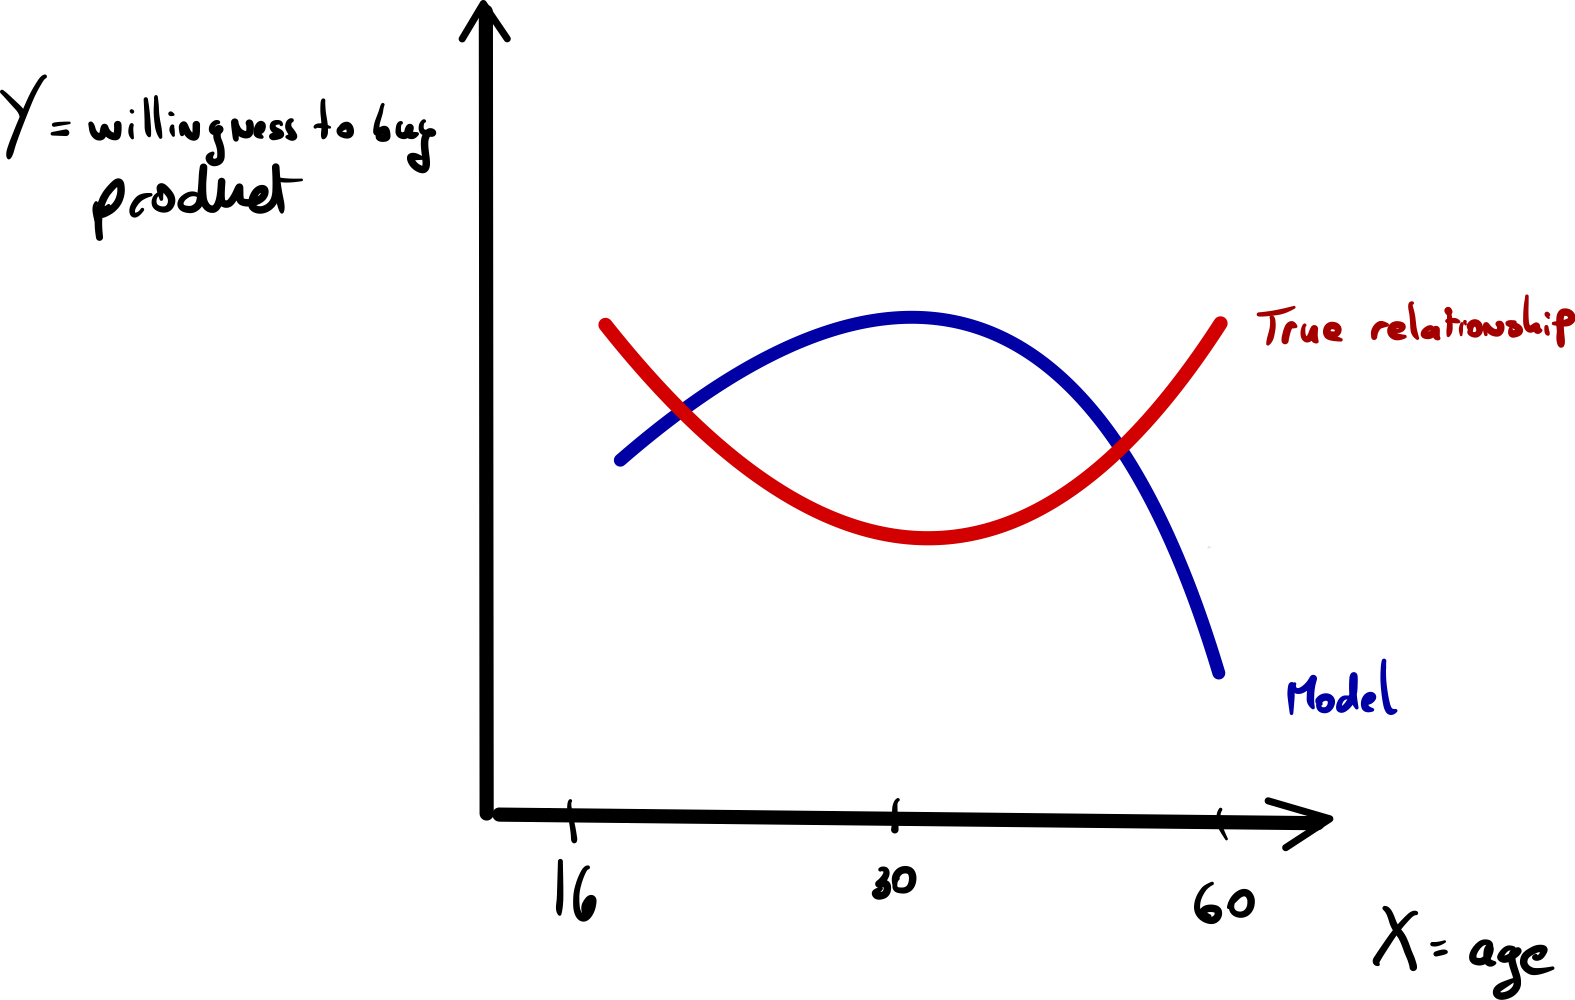
Oh my god, this time the model has literally flipped.
Meaning that the true relationship between X and the target variable has completly changed while your model has remained the same. If we think about that, Apple launches a new Iphone every september so the previous iPhone may become less desirable for people between the ages of 20 and 40, leading to a significant shift in the target variable. However, younger and older people may not be as influenced by the trend, and may still be willing to buy the product, resulting in a complete change in the target variable distribution.
In essence, Concept drift is a phenomenon that occurs when the statistical properties of the target variable (the thing the model is trying to predict) change over time, rendering the model less accurate or even completely obsolete.
This can occur due to changes in the behavior of the system being modeled, changes in the external environment, or other factors...
How to detect Concept Drift ?
Well, you need to analyze your model's performance over time and compare it to its performance on historical data. If the distribution of the target variable remains relatively stable but your model's performance deteriorates, it may indicate a Concept Drift. If you don't have access to the true values to calculate the error, you can consider maintaining a static model as a baseline for comparison.
For classification models, you can also check the average confidence score. If it changes significantly over time, it could be an indication of Concept Drift and should be investigated further.
How to address Concept Drift ?
When there is a Concept Drift in the data, it is usually necessary to retrain the model on new data to update the model and ensure that it remains accurate and reliable. This implies collecting new data that reflects the new distribution or behavior of the system.
Moreover, we may also have to change the model architecture or create a new one. For example, if the true relationship between X and Y changes from linear to logarithmic, we not only have to gather new data but also adapt the model.
A good practice is to regularly retrain and update the model to ensure that it remains accurate and reliable over time.
Other things you should be Monitoring:
In addition to model performance, drifts, and bugs, there are several other factors that you should consider.
-
Outliers: Identify and handle outliers in the input data, as these can skew the model's output and lead to inaccurate predictions (this can be part of the Data Drift monitoring).
-
Bias: Monitor for bias in the model's output, especially when the model is used in sensitive applications. Ensure that the model does not discriminate against certain groups of people and that its predictions are fair and ethical.
-
Robustness: Test the model's robustness by introducing adversarial examples or other forms of attacks that could potentially fool the model. This can help you identify and fix vulnerabilities in the model before they are exploited.
That's all for today folks, I hope you enjoyed this article !